Field note
Monitoring the Homelab with Beszel
Setting up Beszel as a lightweight, clean, node-based monitoring dashboard across Proxmox, Pi 4, and Windows.
Once a homelab grows past a single machine, keeping track of resources becomes a necessity. I needed a lightweight, unified dashboard to monitor my infrastructure without the massive overhead of a full Grafana + Prometheus stack. Enter Beszel.
The Architecture
Beszel is incredibly lightweight and consists of two parts:
- The Hub: A central web interface where all the metrics are collected and displayed.
- The Agent: A tiny service that runs on each node you want to monitor, feeding data back to the hub.
My Monitoring Setup
Right now, my Beszel dashboard looks like this:
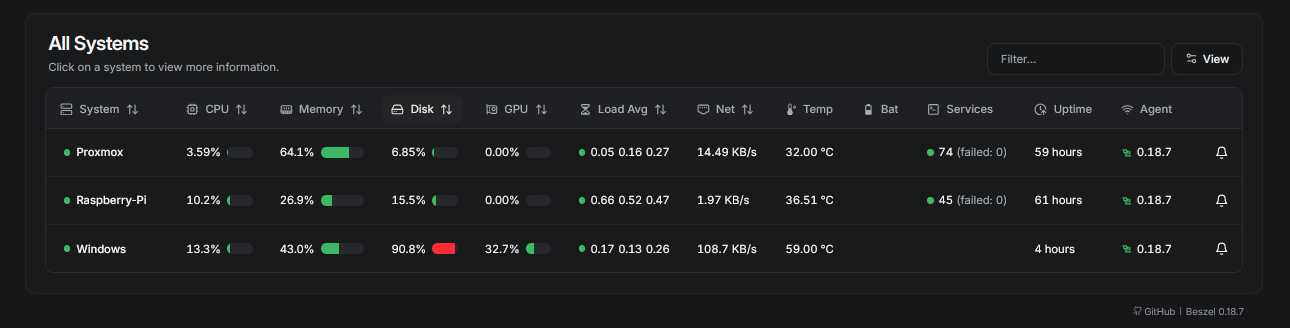
I'm currently tracking three critical pieces of hardware in my stack:
1. The Proxmox Host
My main hypervisor is currently cruising at a comfortable 3.51% CPU utilization, despite running 74 separate services! Proxmox is incredibly efficient, and Beszel shows exactly how much breathing room I have left on my RAM (about 36% free out of 32GB).
2. The Raspberry Pi 4
Since moving Pi-hole, Unbound, and a dozen other services onto my Raspberry Pi 4, I've been keeping a close eye on it. As you can see, it handles 45 active services effortlessly at under 10% CPU. The temperature sits at a cool 36.5°C thanks to the dedicated fan.
3. The Windows Box
I'm also tracking my Windows machine, which unsurprisingly idles higher than the Linux boxes (11.5% CPU) and has a significantly higher disk footprint.
Why Beszel?
The best thing about Beszel is how visually clean it is. I don't have to decipher complex time-series graphs to know if my homelab is healthy. At a single glance, I can verify CPU load, RAM allocation, temperatures, and exact uptime.
If you are running Proxmox LXCs or Raspberry Pis and want instant observability, I highly recommend throwing Beszel onto your stack.